Greece Economic Statistics
The latest macroeconomic forecast for Greece.
After a solid yet slightly reduced economic performance in 2023, it’s anticipated that GDP growth will see a slight increase in both 2024 and 2025.
This boost is likely to be propelled by exports, investments, and private consumption. Inflation is forecasted to ease, with headline inflation expected to decrease to 2.1% by 2025.
Moreover, the general government deficit is projected to diminish further due to restrained expenditure growth, while the public debt ratio is forecasted to continue declining.
With pent-up demand largely exhausted, private consumption is now mainly supported by rising real income and it is set to increase at a slightly lower rate in 2024. The projected gradual easing of financing conditions and the accelerated implementation of RRP-related projects are forecast to stimulate gross fixed capital formation, which is expected to pick up from 4.0% in 2023 to 6.7% in 2024.
Greece Economic Indicators
It sounds like Greece experienced a robust economic rebound post-pandemic, with real GDP growth remaining strong at 2% in 2023. This growth rate surpasses Greece’s long-term growth potential as well as the average growth rate of the euro area, indicating a period of economic vitality. Several factors seem to have contributed to this growth:
- Private Consumption: Increased real disposable incomes likely fueled higher private consumption, indicating growing consumer confidence and spending power among Greeks.
- Investment in Construction: The investment in construction suggests confidence in the real estate sector and infrastructure development, which often plays a significant role in economic growth.
- Net Exports: Positive contributions from net exports indicate that Greece’s exports exceeded its imports, contributing positively to economic activity. This could be due to increased competitiveness or external demand for Greek goods and services.
- Inventories: The drag on growth from inventories suggests that businesses may have reduced their inventories, possibly due to cautious inventory management strategies or shifts in demand patterns.
Overall, the combination of strong private consumption, investment in construction, and positive contributions from net exports indicates a broad-based recovery for the Greek economy in 2023.
Greece has a capitalist economy with a public sector accounting for about 40% of GDP and with per capita GDP about two-thirds that of the leading euro-zone economies. Tourism provides 18% of GDP. Immigrants make up nearly one-fifth of the work force, mainly in agricultural and unskilled jobs. Greece is a major beneficiary of EU aid, equal to about 3.3% of annual GDP.
| GDP | Reference | Last | Previous | Units | Frequency |
|---|---|---|---|---|---|
| Real Private Consumption | 2023 Q4 | 34,407 | 33,935 | Mil. Ch. 2010/2015 EUR, SA | Quarterly |
| Private Consumption | 2023 Q4 | 38,390 | 37,767 | Mil. EUR, SA | Quarterly |
| Government Consumption | 2023 Q4 | 11,058 | 10,805 | Mil. EUR, SA | Quarterly |
| Nominal Gross Domestic Product | 2023 Q4 | 55,666 | 55,457 | Mil. EUR, SA | Quarterly |
| Real Government Consumption | 2023 Q4 | 9,808 | 9,594 | Mil. Ch. 2010/2015 EUR, SA | Quarterly |
| Investment | 2023 Q4 | 7,628 | 7,989 | Mil. EUR, SA | Quarterly |
| Real Investment | 2023 Q4 | 6,740 | 6,920 | Mil. Ch. 2010/2015 EUR, SA | Quarterly |
| Nominal Fixed Investment (gross fixed capital formation) | 2023 Q4 | 7,628 | 7,989 | Mil. EUR, SA | Quarterly |
| Real Gross Domestic Product | 2023 Q4 | 48,756 | 48,680 | Mil. Ch. 2010/2015 EUR, SA | Quarterly |
| Real Fixed Investment (gross fixed capital formation) | 2023 Q4 | 6,740 | 6,920 | Mil. Ch. 2010/2015 EUR, SA | Quarterly |
Data Source: Moody’s Analytics – https://www.economy.com/greece/indicators
| Price | Reference | Last | Previous | Units | Frequency |
|---|---|---|---|---|---|
| Consumer Price Index (CPI) | Apr 2024 | 117.96 | 117.39 | Index 2020=100, NSA | Monthly |
| Producer Price Index (PPI) | Mar 2024 | 134.98 | 137.35 | Index 2015=100, NSA | Monthly |
| Wholesale Price Index | Dec 2004 | 110.42 | 109.93 | Index 2005=100 | Monthly |
| Labor | Reference | Last | Previous | Units | Frequency |
| Total Employment Non-Ag | Mar 2024 | 4,325 | 4,292 | Thousands, SA | Monthly |
| Primary Industries Employment | 2023 Q4 | 491.9 | 481.3 | Ths. #, NSA | Quarterly |
| Tertiary Industries Employment | 2023 Q4 | 3,008 | 3,095 | Ths. #, NSA | Quarterly |
| Labor Force Employment | 2023 Q4 | 4,183 | 4,256 | Ths. #, NSA | Quarterly |
| Total Employment | 2023 Q4 | 4,183 | 4,256 | Ths. #, NSA | Quarterly |
| Unemployment Rate | 2023 Q4 | 10.5 | 10.8 | %, NSA | Quarterly |
| Secondary Industries Employment | 2023 Q4 | 678.8 | 677.3 | Ths. #, NSA | Quarterly |
| Labor Force | 2023 Q4 | 4,671 | 4,770 | Ths. #, NSA | Quarterly |
| Unemployment | 2023 Q4 | 488.7 | 514.6 | Ths. #, NSA | Quarterly |
| Wage & Salaries | 2023 Q4 | 19,354 | 19,228 | Mil. EUR, SA | Quarterly |
| Agriculture Employment | 2017 | 591,868 | 607,088 | # | Annual |
Data Source: Moody’s Analytics – https://www.economy.com/greece/indicators
| Real Estate | Reference | Last | Previous | Units | Frequency |
|---|---|---|---|---|---|
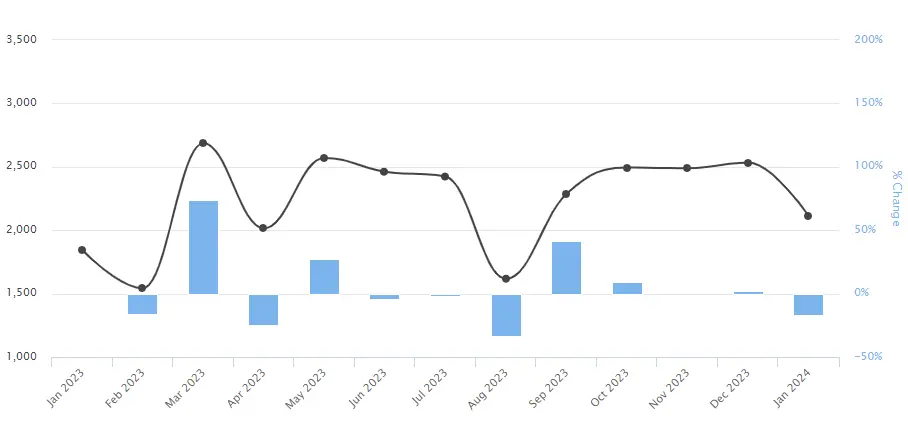
| Building Permits | Jan 2024 | 2,112 | 2,533 | #, NSA | Monthly |
| Building Completions | Jan 2024 | 871 | 981 | #, NSA | Monthly |
| Residential Building Completions | Jan 2024 | 3,114 | 3,355 | #, NSA | Monthly |
| House Price Index | 2023 Q4 | 245.4 | 240.3 | Index 1997=100, NSA | Quarterly |
| Consumer | Reference | Last | Previous | Units | Frequency |
| Consumer Confidence | Apr 2024 | -41.7 | -44.7 | SA | Monthly |
| Retail Sales | Feb 2024 | 104.8 | 101.1 | Index 2021=100, NSA | Monthly |
| Real Retail Sales | Feb 2024 | 88.8 | 85.5 | Vol. Index 2021=100, NSA | Monthly |
| Personal Income | 2021 | 10,832 | 9,952 | EUR | Annual |
Data Source: Moody’s Analytics – https://www.economy.com/greece/indicators
Summary of latest developments.
In the third quarter of 2023, there was a 2.1% year-on-year decrease in global house prices adjusted for consumer prices, slightly less than the 2.3% decline observed in the second quarter. This change in real terms signaled the first increase in nominal prices (2.5%, up from 2.3%), ending a prolonged period of nominal price deceleration since early 2022. Additionally, there was a stabilization in consumer price index (CPI) inflation during this period.

Everything you need to know about the property transaction and home buying process in Chania, Crete.