Global House Price Index
The Role of the Global House Price Index.
The GHPI provides valuable insights into the performance of residential real estate markets, allowing investors, policymakers, and analysts to compare housing market conditions globally.
The index tracks changes in house prices over time, typically on a quarterly or annual basis, and is often used to gauge the health of the real estate market and the broader economy. Factors influencing the index include economic growth, interest rates, inflation, government policies, and demographic trends.
Global Housing Prices
Understanding the Global House Price Index is crucial for anyone involved in the real estate market, as it offers a clear view of global housing trends and market dynamics.
For instance, in Greece, the real estate market has shown a remarkable recovery over the past few years, following a prolonged period of economic downturn.
The Greek property market, especially in popular areas such as Athens, Thessaloniki, and the islands, has been attracting significant interest from both domestic and international investors. Factors such as tourism growth, favourable investment incentives, and the Golden Visa program have contributed to this resurgence.
Monitoring the Global House Price Index helps stakeholders keep track of these positive trends and make informed decisions about entering or expanding their investments in the Greek real estate market.
In Q2 2023, the annual global house price growth experienced a slight uptick from 2.9% in Q1 2023 to 3.0%. Although nearly forty percent of markets observed price decreases over the past year, around a third witnessed declines over the past three months. This suggests a modest enhancement in global market conditions.
The Data is provided to Users “as is” and without warranty of any kind, either express or implied, including, without limitation, warranties of merchantability, fitness for a particular purpose and noninfringement.
The IMF Data is available free of charge from the IMF.
Users are prohibited from infringing upon the integrity of the IMF data and in particular shall refrain from any act of alteration of the IMF data that intentionally affects its nature or accuracy. If the IMF data is materially transformed by the user, this must be stated explicitly along with the required source citation.
All other terms set forth in the IMF’s general terms and conditions (http://www.imf.org/external/terms.htm) shall continue to apply to the use of IMF Data.
Source: http://www.imf.org/external/research/housing/index.htm
Key Takeaways
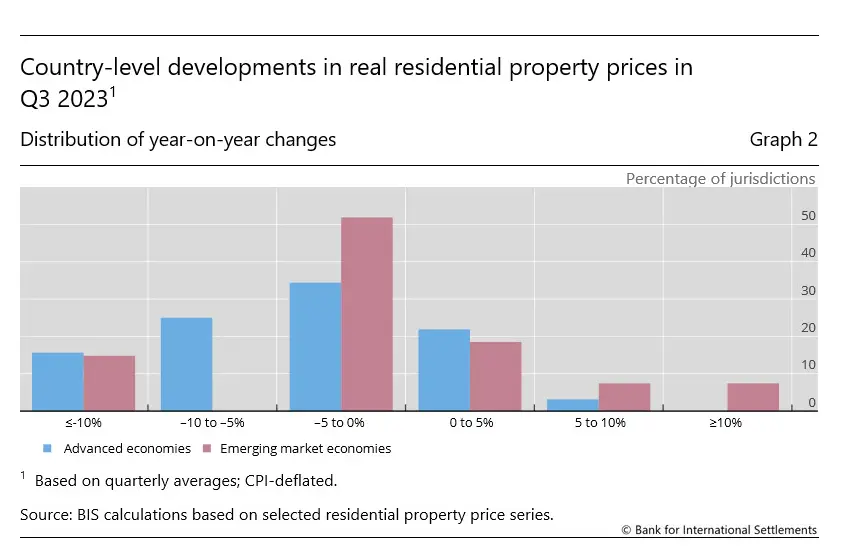
Global house prices experienced a slightly smaller decline in the third quarter of 2023 compared to the previous three months, falling by 2.1% year-on-year (yoy) in aggregate and in real terms.
Real house prices continued to decrease at a faster rate in advanced economies (AEs) (–2.7% yoy) compared to emerging market economies (EMEs) (–1.6% yoy).
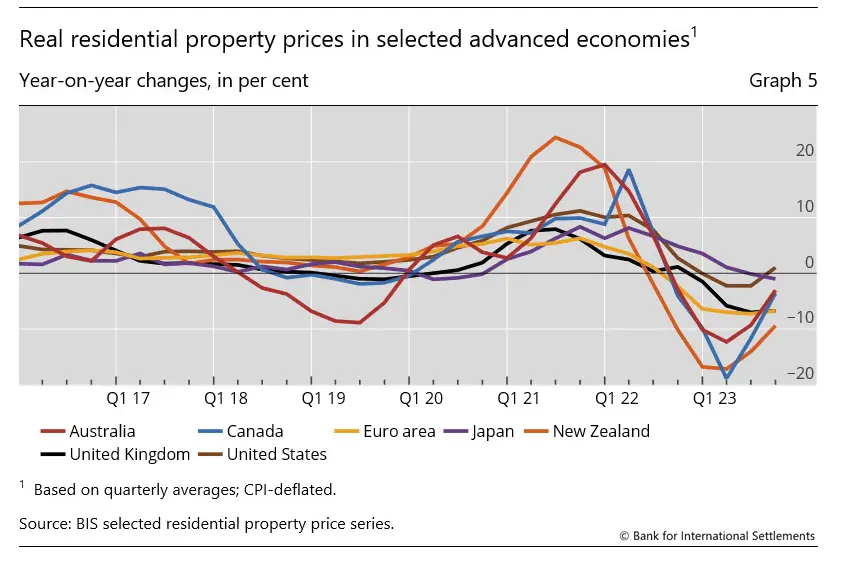
Significant variations persist across major economies. For example, real house prices remained relatively strong in Türkiye, increased in Mexico, were generally stable in Indonesia, Japan, and the United States, but declined sharply in the euro area, the United Kingdom, and even more so in Korea.
In real terms, global house prices are still substantially (23%) above their average level following the 2007–09 Great Financial Crisis (GFC), with prices 33% higher in AEs and 16% higher in EMEs.
Within the euro area, real house prices continue to show significant variations among member states.
Prices surged by 9% in Greece and were up by 4% in Portugal and by 2% in Spain. In contrast, they declined by 4% in Italy (nonetheless representing a slight improvement from the stronger decline observed over the past few quarters), 6% in both France and the Netherlands and, notably, 15% in Germany
Summary of latest developments.
In the third quarter of 2023, there was a 2.1% year-on-year decrease in global house prices adjusted for consumer prices, slightly less than the 2.3% decline observed in the second quarter. This change in real terms signaled the first increase in nominal prices (2.5%, up from 2.3%), ending a prolonged period of nominal price deceleration since early 2022. Additionally, there was a stabilization in consumer price index (CPI) inflation during this period.

Everything you need to know about the property transaction and home buying process in Chania, Crete.